Is Scientific Data Lying to You? In our modern world, we are constantly bombarded with statistics. Whether it’s a headline about a new “superfood,” a political poll, or a pharmaceutical study, we tend to treat numbers as the ultimate source of truth. We assume that because something is “backed by data,” it must be objective, neutral, and accurate.
However, data does not exist in a vacuum. It is collected by humans, analyzed by humans, and presented by humans—all of whom carry their own expectations, motivations, and flaws. As Professor Adetunji Oroye (Ahmadu Bello University, Zaria), highlighted in his webinar with Researchment Academy that scientific reporting is a structured process, but it is one that can be easily compromised.
The truth is that data doesn’t lie, but the process can be tilted.
How to Spot Bias in Scientific Data
This post will help you pull back the curtain on scientific bias, teaching you how to spot the “lies” hidden in plain sight and become a more critical consumer of information.
1. Understanding the Enemy: Bias vs. Random Error
To understand how data misleads us, we first have to distinguish between a simple mistake and a systematic bias. In any scientific experiment, there is always some degree of “noise” or uncertainty.
Random Error is like static on a radio. it’s unpredictable and happens due to the natural variability of the world. For example, if you weigh the same object ten times, a very sensitive scale might give you slightly different readings each time due to tiny changes in temperature or air pressure. These errors usually cancel each other out over a large enough sample size.
Bias, on the other hand, is a systematic distortion. It isn’t a random fluctuation; it is a consistent “lean” in one direction. If that same scale is improperly calibrated and always adds two grams to every measurement, that is bias. In research, bias moves the results away from the true value toward a specific, often desired, outcome. Professor Oro notes that while errors are inevitable, bias is often a result of how a study is designed or how the data is handled.
READ ALSO: 3 Ways to Write Impactful Research Introductions | Capture and Maintain Reader Attention
2. Selection Bias: The “Who” Matters
One of the most common ways data “lies” is by looking at the wrong group of people. If the sample doesn’t represent the whole population, the results cannot be applied to everyone. This is known as Selection Bias.
Consider the “Healthy Volunteer” effect. If a study on a new fitness regime only recruits people who are already active and health-conscious, the results will look amazing. However, those results might not apply to the general population, which includes people with chronic illnesses or sedentary lifestyles.
Another fascinating example mentioned by Professor Adetunji Oroye is Survivorship Bias. This occurs when we only look at the individuals who “survived” a process. For instance, if you only study the habits of billionaire tech moguls to find the “path to wealth,” you are ignoring the thousands of people who did the exact same things but went bankrupt. By ignoring the failures, the data gives you a distorted map of reality.
-
Volunteer Bias: People who take the time to fill out surveys often have stronger opinions than those who don’t.
-
Attrition Bias: In long-term studies, if the people who are doing poorly drop out, the final results will look much better than they actually are.
3. Measurement Bias: When the “Ruler” is Broken
Even if you have the right people, you can still get the wrong data if your tools or methods are flawed. Measurement Bias occurs during the actual data collection phase.
One subtle version of this is Observer-Expectancy Bias. If a researcher expects a certain drug to work, they might subconsciously record a patient’s slight improvement as “significant,” while ignoring signs of regression. This is why “Double-Blind” studies—where neither the patient nor the researcher knows who got the real medicine—are the gold standard for quality science.
There is also the issue of Social Desirability Bias. When people are asked sensitive questions (about their diet, exercise, or voting habits), they often give the “right” answer rather than the “true” answer. This creates data that reflects how we want to be seen, rather than how we actually behave.
READ ALSO: 3 Research Crimes That will get your Paper Retracted
4. The Visual Trap: Lying with Graphs
Data visualization is a powerful tool, but it is also one of the easiest ways to manipulate an audience. A graph can be technically “accurate” in terms of the numbers it uses while being completely dishonest in the story it tells.
The most common trick is Truncating the Y-Axis. A graph’s vertical axis should typically start at zero. If a researcher wants to make a small difference look like a massive leap, they might start the axis at 90 instead of 0.
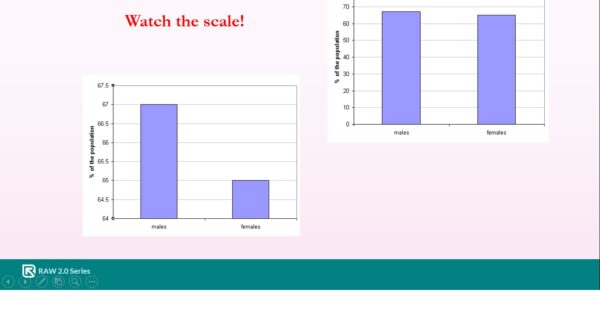
Imagine a graph showing a rise in test scores from 91% to 92%. If the graph starts at zero, the line looks almost flat. If the graph starts at 90, the line appears to skyrocket. Professor Oro emphasized that you must always check the scale of the axes before drawing a conclusion from a visual trend.
5. Reporting Bias: What They Don’t Tell You
Sometimes the lie isn’t in what is said, but in what is left out. This is often called Publication Bias or the “File Drawer Problem.”
Scientific journals are much more likely to publish a study that finds something “new” or “exciting” than a study that finds “no change.” As a result, researchers who don’t find the results they were looking for might simply put their work in a file drawer and never publish it.
This creates a distorted reality where we only see the “successful” trials. If ten studies are done on a new herbal supplement and nine find it does nothing while one finds a small benefit, only that one might get published. To the public, it looks like “science proves” the supplement works, when in reality, the weight of the evidence says it doesn’t.
READ ALSO: How to Stop Losing Grants | 7 Strategies to Secure Research Funding
How to Protect Yourself: A Critical Checklist
You don’t need a PhD to spot bias. You just need to ask the right questions. Next time you see a “scientific” claim, run it through this mental filter:
-
Who funded the study? Follow the money. If a study saying “chocolate is a health food” was funded by a candy company, be skeptical.
-
How big was the group? A study of five people is a set of anecdotes; a study of 5,000 people is data.
-
What was the “control”? Did they compare the new thing against nothing, or against the current best version?
-
Is the graph trying to scare me? Look at the numbers on the side of the chart. Is the scale fair, or is it zoomed in to create drama?
-
Is this a “one-off” or a trend? One study rarely proves anything. Look for “meta-analyses”—studies that combine the results of many other studies to find the broader truth.
Conclusion
Science is a magnificent tool, but it is a human one. Professor Adetunji main message was that the remedy for bias is transparency. We need researchers who are willing to publish their failures as well as their successes, and we need a public that is educated enough to look past the headlines and into the methodology.
Data isn’t lying to you, but people might be using data to tell a specific story. By understanding these biases, you move from being a passive observer to an informed critic.
Stay Connected & Informed: Want to be the first to know about our upcoming research events and exclusive webinar updates? Follow Researchment on Facebook, LinkedIn and Instagram.
Unlock Future Opportunities: Ready to elevate your research journey with more insightful sessions like this one? Visit academy.researchment.com to register for upcoming webinars. Our Researchment Academy series is packed with knowledge to empower you!
Ready to Elevate Your Research? Publish with Glintplus!
Stop waiting and start making an impact. Submit your manuscript to one of our esteemed journals at glintplus.com/journals and become part of a thriving community of researchers who trust Glintplus for:
- Unwavering Quality: Rigorous peer review and high editorial standards.
- Maximum Visibility: Broad indexing and effective dissemination of your work.
- Academic Integrity: Ethical publishing practices you can rely on.
Take the Next Step in Your Publication Journey:
 Ready to Submit? Visit glintplus.com/journals to explore our journals and streamline your submission process.
Need a Manuscript Makeover? Our expert editorial support and comprehensive author resources are here to help you shine. Contact us today via publish@glintplus.com!
Never Miss an Opportunity! Stay ahead of the curve by following Glintplus on Facebook, LinkedIn and Instagram for the latest updates and publishing tips.
Let’s collaborate to amplify your groundbreaking research and ensure it reaches the global audience it deserves.